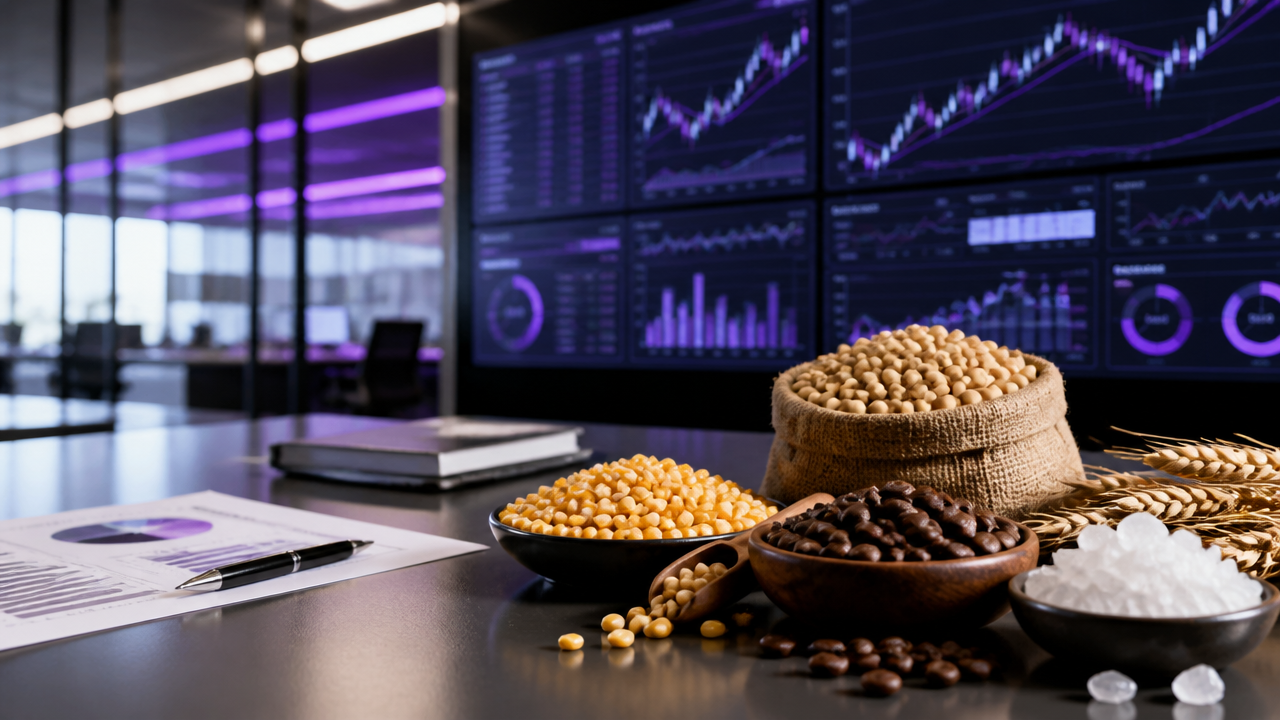
The soybean complex moves in sync with the global agri-food and energy economy. At its core is the “board crush margin,” a measurement that connects physical and financial markets, indicating the difference between the value of products obtained from processing soybeans and the cost of acquiring the beans themselves. For growers, processors, and traders, understanding this spread is the compass for navigating opportunities and risks in a volatile market. Far from being just a theoretical concept, crush margin shapes investment, pricing, risk management, and expansion decisions in the soybean value chain—decisions increasingly driven by data and analytics tools from specialized platforms like Uhedge, which unify risk and hedge accounting for participants.
What is board crush and why does it matter?
At the heart of every soybean processor's business lies a simple equation: transforming raw soybeans into two primary outputs—soybean meal and soybean oil. The gross processing margin represents the difference between the combined sales value of oil and meal and the cost of the input soybeans. However, in practice, “board crush” refers specifically to the margin derived from futures prices—typically those traded on reference exchanges such as the CME. The board crush margin gives an at-a-glance gauge of processing profitability using market-quoted values for beans and derivative products.
This indicator guides whether it makes economic sense for a processor to crush beans, adjusts risk postures up and down the chain, and signals to farmers, merchandisers, co-ops, and financial institutions where opportunity—or hazard—may lie. As explained by the USDA ERS, margin analysis fundamentally shapes processors’ operating decisions and future processing commitments, making margin tracking a core discipline in commercial risk management. USDA ERS study
The margin is dynamic, reactive to both macro and micro forces: supply and demand for beans, movements in feed and edible oil consumption, policy interventions, logistics challenges, and, significantly, the growing links with energy markets through biofuels.
The mechanics of crush margin calculation
While physical processors calculate net margin using realized sales, logistics, energy, and overhead costs, the board crush is calculated using futures contracts, which standardize values and offer an accessible benchmark for market participants. Here’s how it works.
Crush margin = (Futures value of meal and oil) – (Futures cost of soybeans)
The board crush calculation brings together the futures price of soybean oil and meal, subtracting the relevant amount—based on yield ratios and contract sizes—of the underlying soybean futures contract. To standardize for different contract quantities internationally, the typical U.S. benchmark assumes:
- 1 short ton (2,000 lbs or 907.185 kg) of soybeans yields roughly 44 lbs of oil and 250 lbs of meal
This relationship is embedded into the exchange-traded “crush spread”—effectively, the simultaneous purchase and sale of soybean, meal, and oil contracts. It enables processor-hedgers and speculative traders alike to monitor and lock spreads.
A positive and widening margin signals processing profitability; a narrowing or negative one points to stress and potential cutbacks.
Futures contracts, delivered in well-defined lots, abstract away physical grade and location differences, but the real-world implications are always present for actual processors. External factors like seasonal supply, regional basis, shipping costs, and product conversion rates all shape realized cash margins.

The importance of board crush for growers, processors, and traders
Growers, co-ops, and traders all face exposure to shifting margins, but in different ways:
- Growers are affected because the health of local crushers influences local basis and cash bids for beans, especially at harvest when surpluses and logistical snags are frequent.
- Processors live by the spread. Their willingness to buy beans and run plants at capacity rests on expected and actual margins. When margin narrows or goes negative, they scale back or halt runs.
- Commodity traders exploit relative price moves, seek arbitrage between cash and futures spreads, and provide liquidity for end users.
For all these groups, tracking the margin is a risk, market sentiment, and operational signal. Margin analysis helps firms decide what quantity to process, when to lock prices, and the degree of risk that can safely be carried or hedged. Uhedge empowers stakeholders by consolidating both physical and financial data streams, providing visibility and discipline that is difficult to achieve with spreadsheets or fragmented statements alone.
Calculating board crush: Step-by-step breakdown
To understand how to arrive at the margin, let’s walk through an example, using standard CME contracts:
- Soybean future: 5,000 bushels (1 bushel ≈ 60 lbs)
- Soybean meal future: 100 short tons
- Soybean oil future: 60,000 lbs (30 short tons)
The calculation is:
Crush margin = (Meal futures price × 22.046 × 0.8) + (Oil futures price × 11) – (Soybean futures price)
The coefficients reflect the average yield from bushels of soybeans in meal (about 80%) and oil (about 18–19%), standardized for contract sizing.
Margin can then be converted into dollars per bushel or per metric ton for easier comparison or internal accounting. USDA ERS chart on 2020 spike highlights how swings in product prices, especially when meal or oil surges, can powerfully move margins even without changes in underlying bean prices.
Futures, hedging, and exposure management
Real-world processors want to “lock in” positive processing margins to protect capital investments and operating plans. They do this by simultaneously selling futures contracts on meal and oil, and buying futures contracts for beans, aligning their hedging with anticipated crushing activity.
Time and again, it has been shown that margin protection stabilizes earnings not just for processors, but for those upstream and downstream as well. Programs like Margin Protection at the USDA Risk Management Agency provide further assurance against unexpected declines, supporting growers' and processors’ need to manage volatile input-output relationships USDA Risk Management Agency description.
- For growers, understanding the current margin can signal stronger or weaker cash bids.
- For crushers, daily or even intraday adjustments in hedges are made as crush spread fluctuates.
- For traders and originators, board crush becomes a tool to spot opportunities, cover exposures, or arbitrage mispricings.
Platforms like Uhedge’s “tesouraria digital,” using modern analytics and artificial intelligence, enable automatic recommendations, portfolio aggregation, and mark-to-market calculations for real-time visibility and compliance, which enhances confidence in operational and audit outcomes.
The biofuel effect and policy waves
There’s a new force reshaping the economics: biofuel demand. With policies driving increased usage of renewable diesel (HVO), biodiesel (FAME, B100), and related blends, demand for both soybean oil and meal has shifted. Oil, previously a lower-value co-product, now commands a premium thanks to its role in renewable fuels.
This structural change is not subtle. In the U.S., domestic soybean crush volumes have been forecast to reach record highs, with growth propelled by the biofuel sector but also by ongoing feed demand for meal. USDA ERS reporting forecasts a record 2.49 billion bushels processed in 2025/26, underlining how policy changes and incentives can directly expand aggregate demand and, in turn, influence processing margin decisions USDA ERS chart-of-note.
Risks arise, too: if policy incentives shift, or supply chains for biofuels tighten, the margin can see wild swings. Processors, therefore, must watch not only agricultural markets, but legislation and macroeconomic shifts.
Seasonality, basis, and logistics—the margin’s hidden levers
Processors’ realized margins depend not just on the board levels, but on complex local variations. These include:
- Seasonality. Harvest pressure can widen local supply, temporarily depressing cash soybean bids and improving margin for crushers. Conversely, lean periods or disruptions can swing basis and port differentials rapidly.
- Basis risk. The difference between exchange-quoted prices and the local cash market must be managed, especially as logistics, freight, or weather factors intervene.
- Freight and logistics. Congestion, port delays, or regulatory changes can eat into margin, sometimes eclipsing board spreads.

Uhedge addresses these complexities by integrating logistics, basis analytics, and physical-plus-financial operations, so users see not just theoretical spreads, but real, actionable risk and margin management data—a major upgrade from splintered systems or simple spreadsheet tracking.
Practical examples of hedging and advanced margin management
Technical managers seek not only to calculate the margin, but to manage risk through time and uncertainty. Key steps include:
- Executing “crush spread” trades on futures exchanges, or using OTC structures tailored to local needs
- Overlaying options strategies to cap downside or participate in margin expansions
- Tracking parametric VaR (value at risk) and full risk factor analysis—volatility, correlation, basis, logistics
- Automating margin calls and visibility for cash planning and compliance
For instance, when volatility rises, modeling Greeks—delta, gamma, vega, theta—helps highlight exposure points. With platforms like Uhedge, users can monitor performance, stress test scenarios, and even analytically replicate the board crush, substituting OTC options for the standard spread to better fit physical flow, cashflow, or reporting requirements.
The rise in volatility and market fragmentation has shown the value of advanced, unified hedge accounting and compliance tools. By automating monitoring and reporting, Uhedge not only simplifies but enforces discipline—protecting margins and enhancing transparency for Big Four auditors and regulators alike.
Those interested in exploring robust hedge strategies for soybean crushing should review Uhedge’s technical discussions on margin protection and risk management for physical and financial operations, especially the blog’s insights into soybean hedging, strategies for crushers, and protecting margins:
- soybean price protection and hedging
- hedging for soybean crushers
- commodities strategy articles
- margin protection in unpredictable markets
Margin monitoring, risk factors, and unified tools
Board crush margin is not a set-and-forget number. Margin monitoring and risk management require active tools—which is where integrated platforms come into play. Uhedge’s software centralizes these features:
- Real-time value adjustments (mark-to-market) for all physical and financial contracts
- Scenario analyses quantifying margin sensitivity to oil, meal, and bean price shocks
- Automated reporting and risk maps to visualize profit-and-loss exposure across risk factors
- Risk factor decomposition (including basis, logistics, liquidity risks)
This unified approach lets commodity businesses see not just where theoretical margin lies, but where realized and potential margin shifts point to shortfalls or opportunities. That transparency is game-changing for anyone with complex hedge accounting, audit demands, or the need to demonstrate risk discipline to boards and investors.
Conclusion: Turning insight into action
The soybean board crush margin is the pulse of processing economics—shaping grower prices, processor utilization, and trading opportunities. For technical professionals, staying ahead means not just tracking the spread, but managing exposures dynamically, using data-driven risk and accounting platforms to deliver precision and compliance.
Uhedge stands at the edge of this evolution: By unifying physical-plus-financial operations, margin analytics, and risk discipline, it empowers clients to capture upside and control downside—turning volatility into value creation, in a world where others see chaos.
The first step towards margin clarity and robust control is a strategic assessment. For sophisticated actors in the agro-financial chain, the call is simple: Harness best-in-class tools, challenge the complexity, and transform risk from a cost into an opportunity for growth.
To know more about how to safeguard your margin and bring precision to your decision-making, discover the solutions and advisory of Uhedge and experience what it means to be truly proactive in commodity risk management.
Frequently asked questions
What is a soybean board crush margin?
The soybean board crush margin is the difference between the sum of the futures prices for soybean meal and oil (outputs) and the futures price of soybeans (input), serving as an index of processing profitability for crushers using exchange-quoted values.
How is the crush margin calculated?
To calculate crush margin, multiply the respective futures prices of soybean meal and oil by their standard output ratios from one unit of soybeans, then subtract the futures price of soybeans needed for that output. The result, adjusted for contract size and yields, shows the gross margin per unit processed.
What factors influence crush margin changes?
Margin changes arise from shifts in supply and demand for soybeans, oil, and meal, logistics disruptions, policy events like new biofuel mandates, seasonal availability, basis risk (the spread between cash and futures prices), and volatility in currency and related commodity markets. Sudden surges in meal or oil prices can expand margins, while collapsing demand or higher soybean input costs can compress or invert them.
How does crush margin affect soybean prices?
Crush margin impacts soybean procurement and cash prices because processors’ willingness to buy beans depends on expected processing profitability; when margins are positive and wide, crushers compete more aggressively for beans, supporting higher local basis and cash bids.
What are the main risks in board crush trading?
Risks include sudden moves in product prices not matched by bean costs, basis and logistics bottlenecks, policy shifts impacting demand or subsidies, and the complexity of hedging multi-leg exposures with spread trades or options. Without unified analytics and compliance tools, traders risk both under-hedging (leaving profit exposed) and over-hedging (locking in losses or creating liquidity crunches).