
Recently, sugar prices have been making headlines—not only in Brazil but across the globe. The volatility is impossible to ignore. An industry participant, following these shifts daily, would recognize that recent movements are not random. Instead, they are the product of a complex equation involving both market mechanics and policy decisions. One could say, sugar’s market story is always evolving, always surprising.
Current landscape: Strong recoveries and new uncertainties
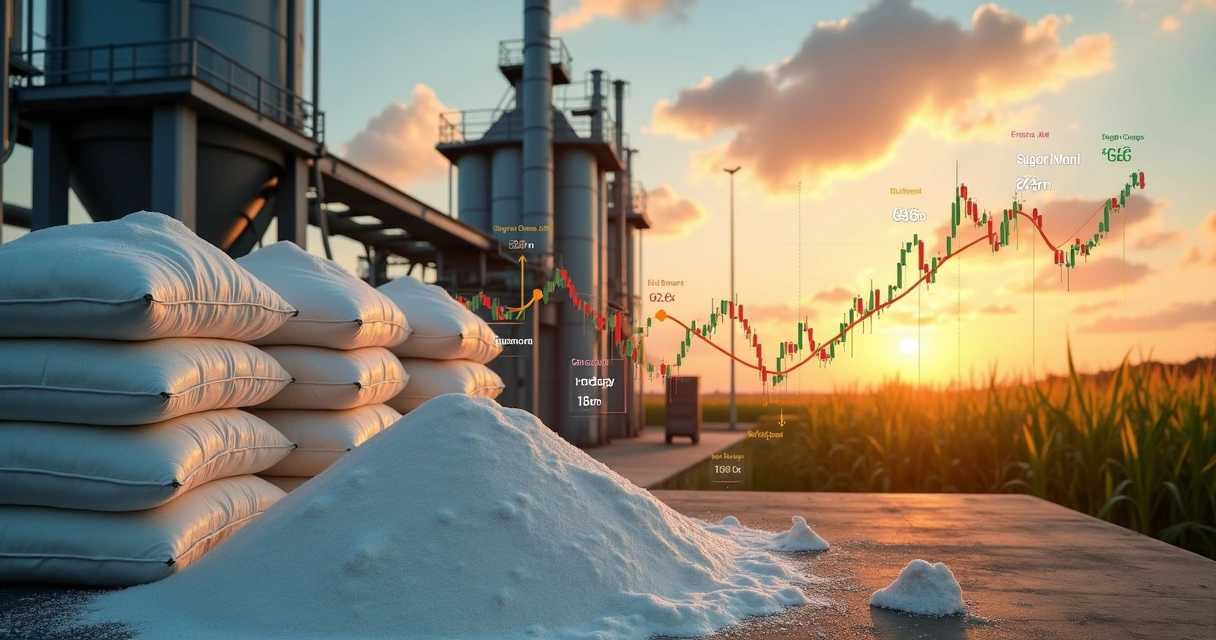
After touching historical lows, with raw sugar at 14.04 cents per pound and white sugar at $406 per ton, a technical recovery in the market swept prices upward. This move has largely been fueled by short covering—a classic rebound after such depressed levels. For the March 2026 contract, raw sugar ticked up by 0.8% to 14.78 c/lb, while white sugar rose 1% to $424.10/t.
But these numbers only tell part of the story. More than price alone, what matters is how various factors push and pull on supply and demand. The project UHEDGE notes that effective risk management is less about reacting to volatility, and more about implementing strategic, data-backed decisions—a lesson underscored by the current landscape.

1. Technical rebounds and short covering
Some of the latest price increases originate from traders who had previously bet on falling sugar values. As those positions unwind, a technical lift appears, sometimes exaggerating the market’s upward move. This is not sustainable upward momentum, though. Short covering can offer temporary relief to producers but can vanish quickly if other market fundamentals do not follow suit.
2. Brazil’s currency and export drivers
The devaluation of the real increases the competitiveness of Brazilian exporters, making it more attractive to export sugar. This naturally adds pressure on global prices, as more supply enters the world market, pulling international values away from sharp upward moves. While Brazil pushes volumes abroad, global buyers respond by adjusting inventories and strategies.
3. India’s ethanol policy shift
The Indian government recently raised the price for ethanol blended into gasoline. This change incentivizes local mills to redirect more cane toward biofuel production rather than crystal sugar. In theory, this tightens sugar supplies, but there is a balancing act. India still authorized 1.5 million tons for export—a figure below expectations, but not disruptive enough to send prices skyward.
4. Surplus on the horizon: ISO projections
According to projections for the 2025/26 cycle, the International Sugar Organization (ISO) expects a surplus of up to 1.625 million tons globally. This surplus puts a ceiling on any major rallies, capping optimism for price spikes. Market participants find their enthusiasm checked by this looming oversupply.
5. Brazilian Center-South’s output in detail
The Center-South region in Brazil is a true powerhouse, churning out 38.085 million tons of sugar by October for the 2025/26 cycle, proving a 1.6% increase year over year. What’s especially interesting is that the harvest continues at an impressive pace after July, and recent Conab estimates point to a record 45 million tons for the current cycle.
But it’s not all positive: even though more cane is being milled, ATR (total recoverable sugar) has been falling. Lower ATR means that each ton of cane produces less sugar, which usually puts a cap on output. In this case, higher total throughput and a larger share of cane channeled to sugar, rather than ethanol, have offset the fall in quality.
6. Cane quality and the ATR dilemma
The ATR index tells a simple truth: less is more when it comes to sugar concentration. Lower ATR pushes mills to crush more cane in pursuit of the same output. For this year, overall milling in Brazil sits near 605 million tons. Producers must therefore find efficiency in operations, making every ton count, as weather and cultivation practices become central to future expectations.
7. Thailand and India: Global production anchors
It is not a one-country drama. India projects 30.95 million tons in 2025/26, while Thailand should surpass 10 million tons. Alongside Brazil, these giants anchor the available supply, helping absorb demand spikes and deterring runaway price surges.
8. The sugar-ethanol split
One of the season’s defining numbers: in Center-South Brazil, 51.97% of processed cane went toward sugar, up from 45.91% last year. This subtle change has outsized effects. Ratios hit 55% in August before falling to 48.24% by October, a tactical move to prevent a supply glut from crushing prices.
Even with ethanol fetching better margins in some locales, only a modest shift is expected this year: sugar remains the priority. Look for ethanol output to dip back to 32.7 billion liters in 2025, as the allocation pendulum swings away from biofuel.
9. Weather, yields, and the challenge of quality
Volatile weather and shifting crop yields are an old story, yet always fresh. In 2025/26, Brazil’s improved growing conditions and expanded acreage keep overall output robust—despite the lower ATR challenge. Mills find themselves in a balancing act: sustain output while wrangling with declining quality, keeping a keen eye on field strategies and supply chain efficiency.
10. Cost discipline and strategic choices
The winners in the next cycle will be those most able to control costs and maintain yields, even when quality declines or global demand shifts. The focus: spend smartly in the field, adopt fit-for-purpose technology, and make every job count. Platforms such as those provided in the UHEDGE ecosystem help unify these decisions with quantitative rigor, turning data into tactical moves.
For those seeking an extra edge, UHEDGE’s digital treasury and advanced analytics bring together position monitoring, risk visualization, and strategic recommendations—delivering full-picture clarity even as market noise rises.
The mixed outlook: Technical lifts and surplus shadows
The market remains divided. In the short run, technical factors offer some price support, especially for Brazilian exporters with sugar ready to move abroad. Yet, the longer-term reality—anchored in projections of a sizeable global surplus and sustained output from Brazil, India, and Thailand—keeps further big upticks unlikely.
Mills navigating this environment must watch not just daily prices, but also shifts in cane quality, production ratios, policy tweaks, and weather. Those decisions, often made in boardrooms or on the mill floor, will ripple across the world. Decisions made today shape tomorrow’s market.
Looking for practical ways to keep ahead? UHEDGE offers detailed strategy and risk management consultation, combining science-driven analytics with almost two decades of market expertise. For those in the sugar, agribusiness, and energy sectors, choosing UHEDGE means seeing signal—not just noise—in every market swing.
The next step: Strategic and disciplined management
For further insight on risk strategies in commodities, readers can consult cases and market signals in the Uhedge content collection on commodities management and volatility risk:
- Commodity insights and analysis
- Sugar price risk reduction and hedging guidance
- Protection against commodity volatility
- Financial planning for mills in commodities
- Margin protection in unpredictable commodity markets
Mill leaders, producers, and traders are invited to schedule a risk diagnosis or request a demonstration of the digital treasury platform, bringing transparency and discipline to decisions that affect results season after season.
Strong decisions grow from clear data and unified strategy.
Frequently asked questions
What causes sugar prices to change?
Sugar values shift due to physical supply and demand factors, global production patterns, government policies, currency movements, and technical trading behavior. Any disruption in cane harvests, changes in ethanol policy, or exchange rate fluctuations can move the market.
How can mills predict sugar price trends?
Mills can use quantitative analytics and digital treasury tools—like those from the UHEDGE ecosystem—to monitor real-time position metrics, global futures curves, and market risk indicators. By aggregating data and using predictive models, mills can make more informed pricing and hedging decisions.
What affects global sugar price the most?
The largest influences are production levels in Brazil, India, and Thailand, currency rates for exporting countries, and government policies on ethanol blending or export limits. Weather can also play a key role, as it directly shapes cane yields and crop quality.
Is it worth it to hedge sugar prices?
Hedging can turn risk from an uncontrollable expense into a managed source of margin, especially during turbulent times. UHEDGE provides digital tools that support disciplined, cost-effective hedging for mills seeking commercial predictability and strategic financial outcomes.
How do weather patterns impact sugar costs?
Bad weather can reduce cane quality (lower ATR), drive up costs per ton, and tighten supply, all leading to upward price adjustments. Conversely, ideal weather boosts yields and can bring values down as surplus builds up. Mills benefit from closely tracking forecasts and integrating weather scenarios into their risk models for smarter decisions.
All market participants face the need for rigorous decision systems. To achieve greater clarity, control, and commercial success in the sugar sector, consider engaging with UHEDGE to see how scientific risk management turns volatility into opportunity.